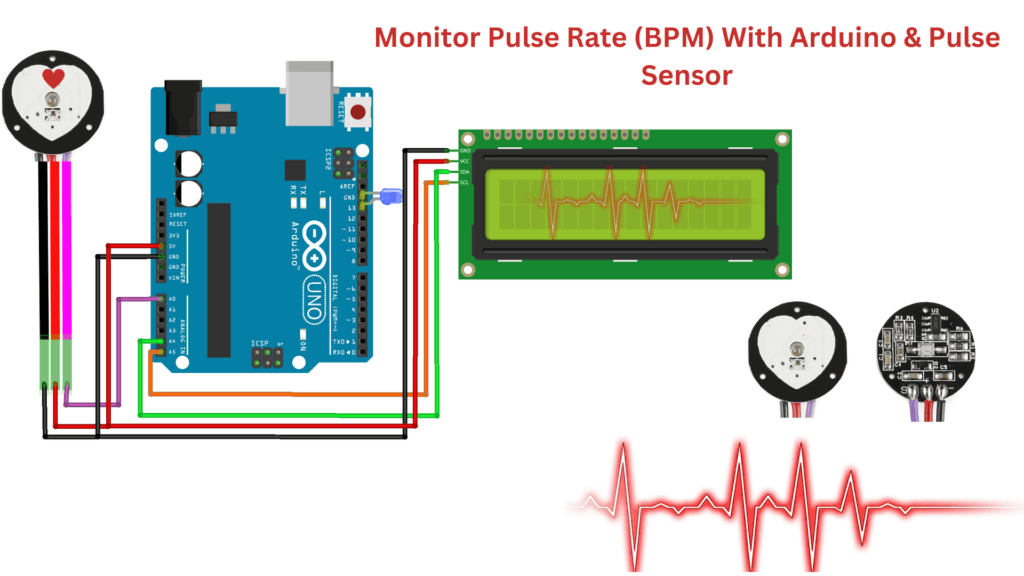
In this project, we will use Arduino & Pulse Sensor to measure your heart rate (BPM). this guide, we’ll show you how to use Pulse Sensor to measure your Heart rate (beats per minute). The Pulse Sensor is a low-power plug-and-play heart-rate sensor that is well designed.
The sensors will signal to 16×2 display to show our pulse rate BPM. this sensor is easy to use and operate. Just place your finger on top of the sensor and it will measure the heartbeat changes.
Required Material
In this tutorial , you will need :
- Arduino UNO
- Pulse Sensor
- 16×2 I2C Display
- Jumper Wires
Pulse Sensor
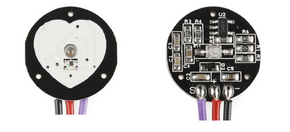
A pulse sensor is Sensor that is used to measure the heart rate. We place the finger on the sensor and it uses to detect the heart rate. heart-rate data can be easily add into projects by artists, athletes, makers, and game & mobile developers who want to track their heart-rate and improve their performance.
To use pulse sensor it is only necessary for you to provide the 3V to 5V DC voltage supply and connect the Analog output to the Analog input of an microcontroller like an Arduino or Raspberry Pi.
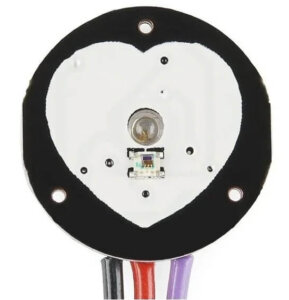
The front of the sensor comes with the heart logo. This is where you would be placing your finger. On the front side, you will see a small round hole, from where the blinking green LED shines. Right below the LED is a small ambient light photo sensor APDS9008 which adjust the brightness depending on the light conditions.
This ambient light sensor functions similarly to the ones found in cell phones, tablets, and laptops to adjust the screen’s brightness based on ambient light conditions.
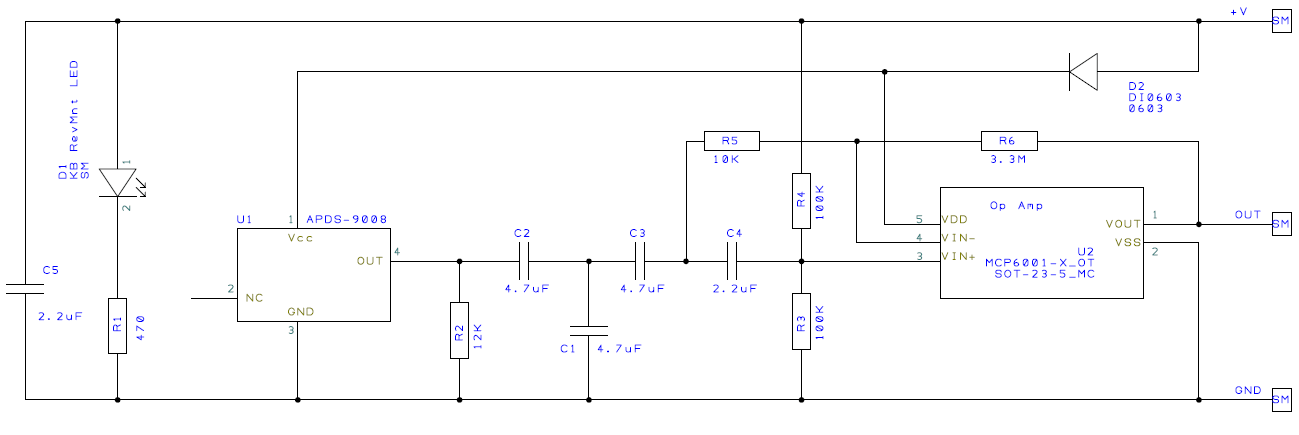
On the back of the module is MCP6001 op-amp from Microchip, resistors and capacitors that make up the R/C filter network filter. Additionally, there is a reverse polarity protection provided by diode to prevent sensor damage if you connect the power leads reverse.
Pinout of Pulse Sensor
Pin Configuration
- Ground (Black):
- VCC (Red) : +5V or +3.3V supply voltage
- Signal (Purple): Pulsating output signal.
Pulse Sensor Schematic
Specification
- Operating Voltage: 3.0V – 5.5V DC
- Sensor: APDS-9008
- Opamp: MCP6001
- green led
- Wire length: 20cm
- Wires: GND, VCC, Signal
Applications
- Sleep Tracking
- Anxiety monitoring
- Remote patient monitoring/alarm system
- Health bands
- Advanced gaming consoles
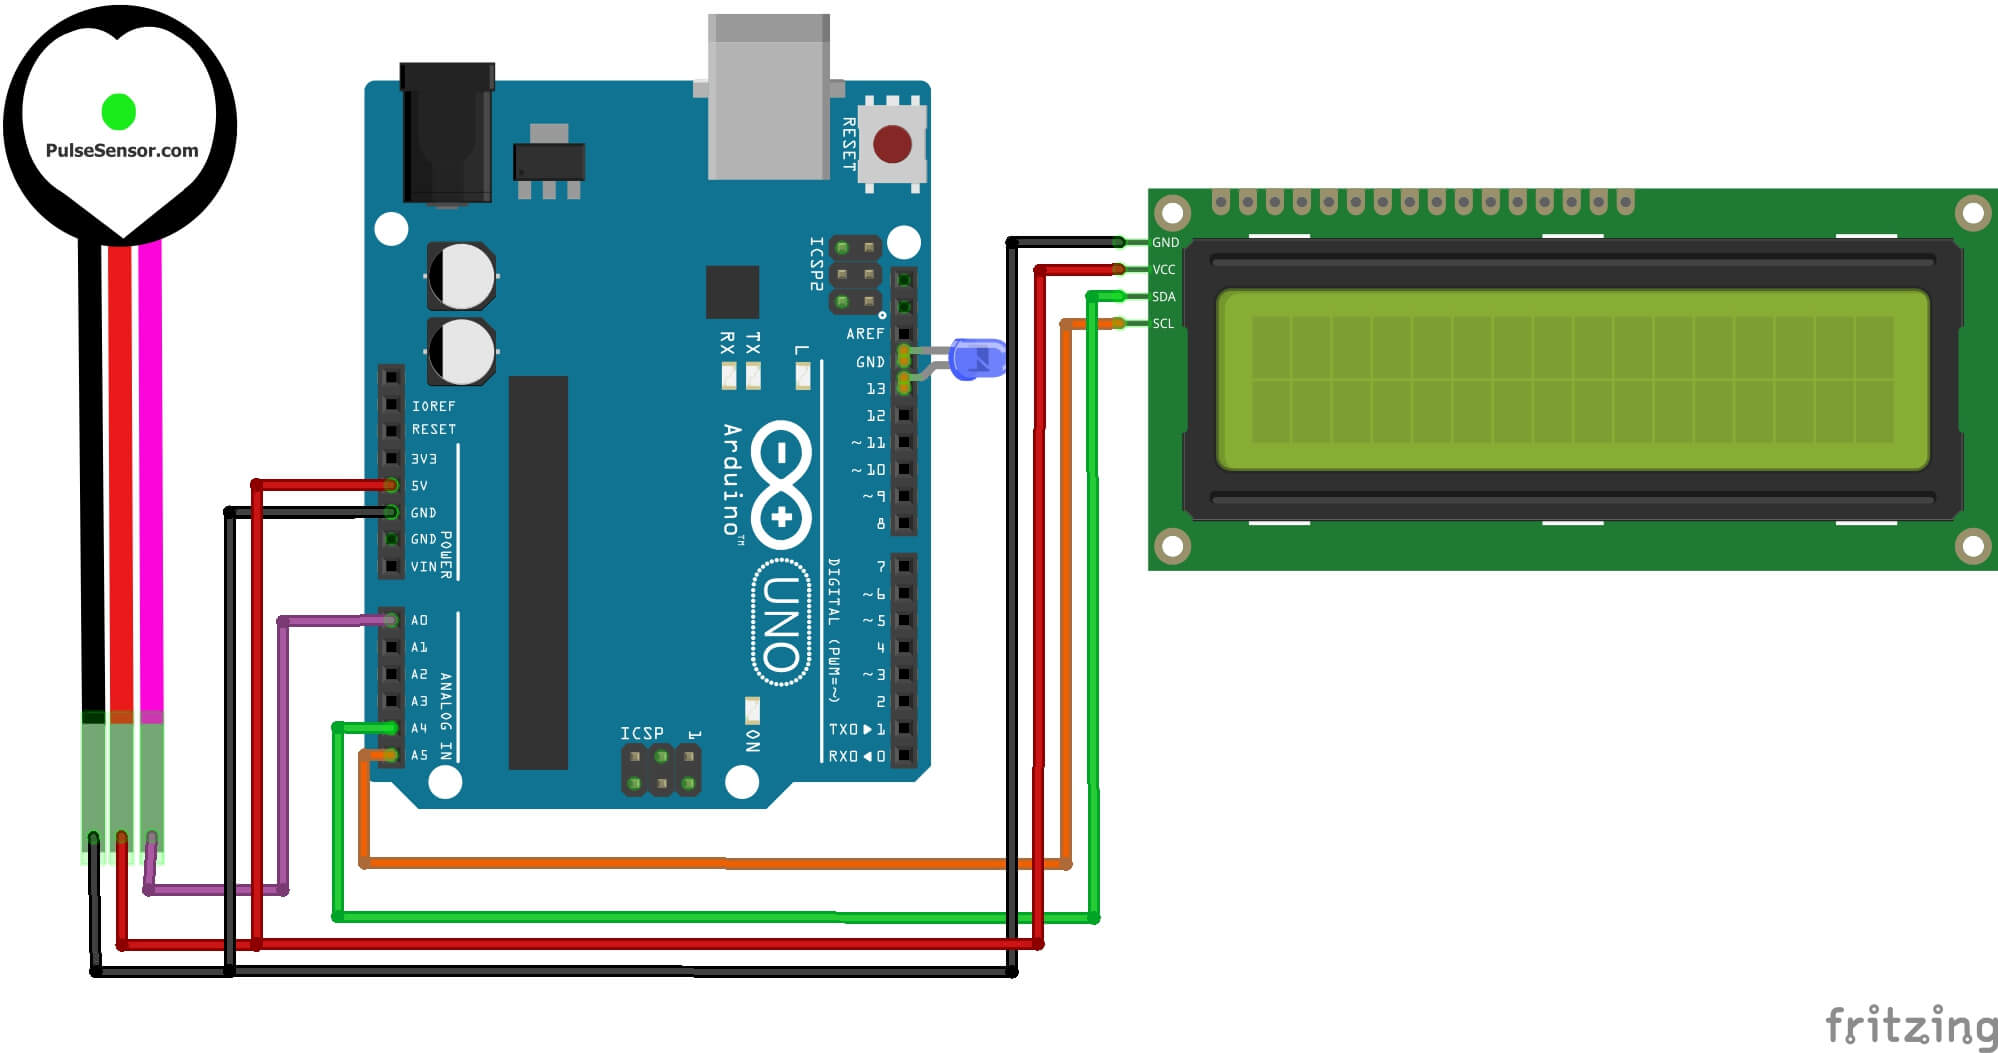
Schematic Diagram – Arduino & Pulse Sensor
Connect Pulse Sensor to Arduino Uno Board as follows:
- VCC to +5V
- GND to GND
- SIGNAL to A0
Code and libraries – Arduino & Pulse Sensor
There are a lot of pulse sensor libraries available for Arduino boards. These libraries allow you to easily interface with a pulse sensor and read the data it provides.
You need to add the PulseSensor Playground library file. you can download the library from here.
or install the library, navigate to Sketch > Include Library > Manage Libraries > PulseSensor Playground. and install it.
This is one of the example codes. You can instantly upload the sketch to the Arduino board.
Source Code
|
1 2 3 4 5 6 7 8 9 10 11 12 13 14 15 16 17 18 19 20 21 22 23 24 25 26 27 28 29 30 31 32 33 34 |
#define USE_ARDUINO_INTERRUPTS true // Set-up low-level interrupts for most acurate BPM math #include <PulseSensorPlayground.h> // Includes the PulseSensorPlayground Library const int PulseWire = 0; // 'S' Signal pin connected to A0 const int LED13 = 13; // The on-board Arduino LED int Threshold = 550; // Determine which Signal to "count as a beat" and which to ignore PulseSensorPlayground pulseSensor; // Creates an object void setup() { Serial.begin(9600); // Configure the PulseSensor object, by assigning our variables to it pulseSensor.analogInput(PulseWire); pulseSensor.blinkOnPulse(LED13); // Blink on-board LED with heartbeat pulseSensor.setThreshold(Threshold); // Double-check the "pulseSensor" object was created and began seeing a signal if (pulseSensor.begin()) { Serial.println("PulseSensor object created!"); } } void loop() { int myBPM = pulseSensor.getBeatsPerMinute(); // Calculates BPM if (pulseSensor.sawStartOfBeat()) { // Constantly test to see if a beat happened Serial.println("♥ A HeartBeat Happened ! "); // If true, print a message Serial.print("BPM: "); Serial.println(myBPM); // Print the BPM value } delay(20); } |
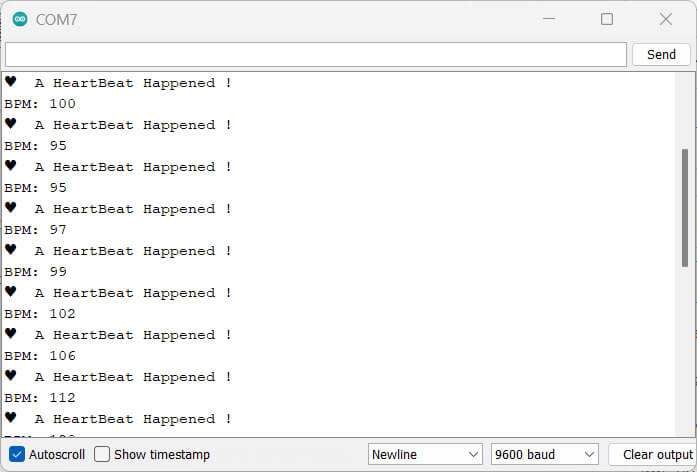
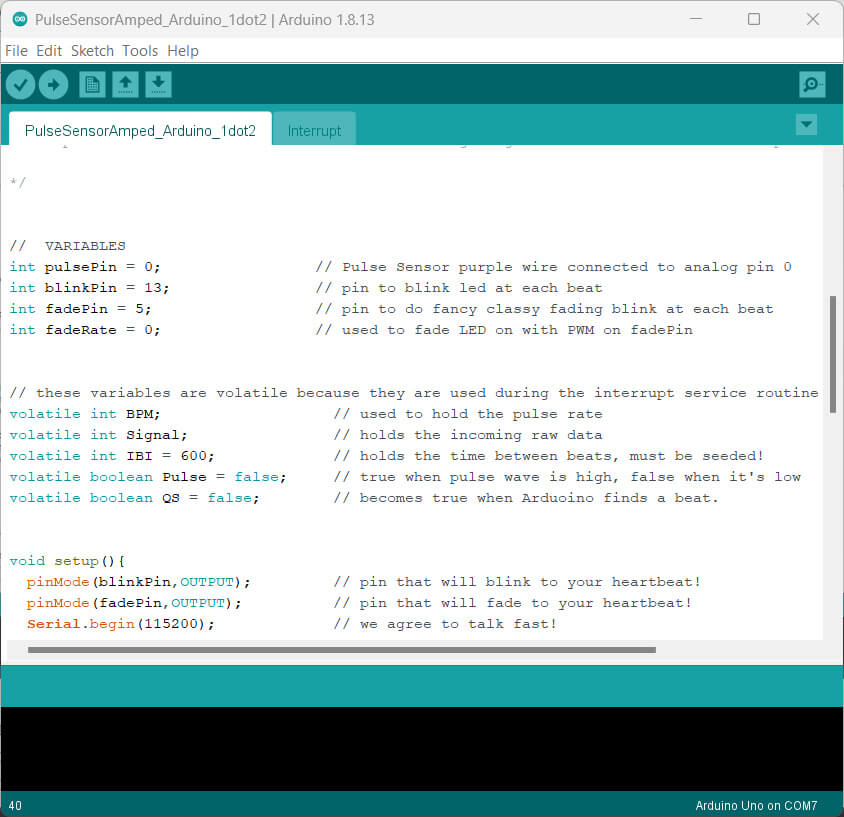
The output of the readings won’t make sense right away after you upload the sketch, so try your best to hold your finger as steady as you can while you wait. You will see something like this. You will see something like this.
Source Code Processing visualization
Now you can see your heartbeat as a line on a graph, or in a more abstract form that shows the rhythm of your heartbeat over time.
Download Processing and Arduino code from here – Arduino Pulse sensor Processing code
Source Code
|
1 2 3 4 5 6 7 8 9 10 11 12 13 14 15 16 17 18 19 20 21 22 23 24 25 26 27 28 29 30 31 32 33 34 35 36 37 38 39 40 41 42 43 44 |
// VARIABLES int pulsePin = 0; int blinkPin = 13; int fadePin = 5; int fadeRate = 0; // used to fade LED on with PWM on fadePin // these variables are volatile because they are used during the interrupt service routine! volatile int BPM; // used to hold the pulse rate volatile int Signal; // holds the incoming raw data volatile int IBI = 600; // holds the time between beats, must be seeded! volatile boolean Pulse = false; // true when pulse wave is high, false when it's low volatile boolean QS = false; // becomes true when Arduino finds a beat. void setup(){ pinMode(blinkPin,OUTPUT); // pin that will blink to your heartbeat! pinMode(fadePin,OUTPUT); // pin that will fade to your heartbeat! Serial.begin(115200); // we agree to talk fast! interruptSetup(); // sets up to read Pulse Sensor signal every 2mS // UN-COMMENT THE NEXT LINE IF YOU ARE POWERING The Pulse Sensor AT LOW VOLTAGE, // AND APPLY THAT VOLTAGE TO THE A-REF PIN //analogReference(EXTERNAL); } void loop(){ sendDataToProcessing('S', Signal); // send Processing the raw Pulse Sensor data if (QS == true){ // Quantified Self flag is true when arduino finds a heartbeat fadeRate = 255; // Set 'fadeRate' Variable to 255 to fade LED with pulse sendDataToProcessing('B',BPM); // send heart rate with a 'B' prefix sendDataToProcessing('Q',IBI); // send time between beats with a 'Q' prefix QS = false; // reset the Quantified Self flag for next time } ledFadeToBeat(); delay(20); // take a break } void ledFadeToBeat(){ fadeRate -= 15; // set LED fade value fadeRate = constrain(fadeRate,0,255); // keep LED fade value from going into negative numbers! analogWrite(fadePin,fadeRate); // fade LED } void sendDataToProcessing(char symbol, int data ){ Serial.print(symbol); // symbol prefix tells Processing what type of data is coming Serial.println(data); // the data to send culminating in a carriage return } |
Processing visualization Code
|
1 2 3 4 5 6 7 8 9 10 11 12 13 14 15 16 17 18 19 20 21 22 23 24 25 26 27 28 29 30 31 32 33 34 35 36 37 38 39 40 41 42 43 44 45 46 47 48 49 50 51 52 53 54 55 56 57 58 59 60 61 62 63 64 65 66 67 68 69 70 71 72 73 74 75 76 77 78 79 80 81 82 83 84 85 86 87 88 89 90 91 92 93 94 95 96 97 98 99 100 101 102 103 104 105 106 107 108 109 110 111 112 113 114 115 116 117 118 119 120 121 122 123 124 125 126 127 128 129 130 131 132 133 134 135 136 137 138 139 140 141 142 143 144 145 146 147 148 149 150 151 152 153 154 155 156 157 158 159 160 161 162 163 164 165 166 167 168 169 170 171 172 173 174 175 176 177 178 179 180 181 182 183 184 185 186 187 188 189 190 191 192 193 194 195 196 197 198 199 200 201 202 203 204 205 206 207 208 209 210 211 212 213 214 215 216 217 218 219 220 221 222 223 224 225 226 227 228 229 230 231 232 233 234 235 |
/* THIS PROGRAM WORKS WITH PulseSensorAmped_Arduino ARDUINO CODE THE PULSE DATA WINDOW IS SCALEABLE WITH SCROLLBAR AT BOTTOM OF SCREEN PRESS 'S' OR 's' KEY TO SAVE A PICTURE OF THE SCREEN IN SKETCH FOLDER (.jpg) PRESS 'R' OR 'r' KEY TO RESET THE DATA TRACES MADE BY JOEL MURPHY AUGUST, 2012 UPDATED BY JOEL MURPHY SUMMER 2016 WITH SERIAL PORT LOCATOR TOOL UPDATED BY JOEL MURPHY WINTER 2017 WITH IMPROVED SERIAL PORT SELECTOR TOOL THIS CODE PROVIDED AS IS, WITH NO CLAIMS OF FUNCTIONALITY OR EVEN IF IT WILL WORK WYSIWYG */ import processing.serial.*; // serial library lets us talk to Arduino PFont font; PFont portsFont; Scrollbar scaleBar; Serial port; int Sensor; // HOLDS PULSE SENSOR DATA FROM ARDUINO int IBI; // HOLDS TIME BETWEN HEARTBEATS FROM ARDUINO int BPM; // HOLDS HEART RATE VALUE FROM ARDUINO int[] RawY; // HOLDS HEARTBEAT WAVEFORM DATA BEFORE SCALING int[] ScaledY; // USED TO POSITION SCALED HEARTBEAT WAVEFORM int[] rate; // USED TO POSITION BPM DATA WAVEFORM float zoom; // USED WHEN SCALING PULSE WAVEFORM TO PULSE WINDOW float offset; // USED WHEN SCALING PULSE WAVEFORM TO PULSE WINDOW color eggshell = color(255, 253, 248); int heart = 0; // This variable times the heart image 'pulse' on screen // THESE VARIABLES DETERMINE THE SIZE OF THE DATA WINDOWS int PulseWindowWidth = 490; int PulseWindowHeight = 512; int BPMWindowWidth = 180; int BPMWindowHeight = 340; boolean beat = false; // set when a heart beat is detected, then cleared when the BPM graph is advanced // SERIAL PORT STUFF TO HELP YOU FIND THE CORRECT SERIAL PORT String serialPort; String[] serialPorts = new String[Serial.list().length]; boolean serialPortFound = false; Radio[] button = new Radio[Serial.list().length*2]; int numPorts = serialPorts.length; boolean refreshPorts = false; void setup() { size(700, 600); // Stage size frameRate(100); font = loadFont("Arial-BoldMT-24.vlw"); textFont(font); textAlign(CENTER); rectMode(CENTER); ellipseMode(CENTER); // Scrollbar constructor inputs: x,y,width,height,minVal,maxVal scaleBar = new Scrollbar (400, 575, 180, 12, 0.5, 1.0); // set parameters for the scale bar RawY = new int[PulseWindowWidth]; // initialize raw pulse waveform array ScaledY = new int[PulseWindowWidth]; // initialize scaled pulse waveform array rate = new int [BPMWindowWidth]; // initialize BPM waveform array zoom = 0.75; // initialize scale of heartbeat window // set the visualizer lines to 0 resetDataTraces(); background(0); // DRAW OUT THE PULSE WINDOW AND BPM WINDOW RECTANGLES drawDataWindows(); drawHeart(); // GO FIND THE ARDUINO fill(eggshell); text("Select Your Serial Port",245,30); listAvailablePorts(); } void draw() { if(serialPortFound){ // ONLY RUN THE VISUALIZER AFTER THE PORT IS CONNECTED background(0); noStroke(); drawDataWindows(); drawPulseWaveform(); drawBPMwaveform(); drawHeart(); // PRINT THE DATA AND VARIABLE VALUES fill(eggshell); // get ready to print text text("Pulse Rate Visualizer (BPM)",245,30); // tell them what you are text("IBI " + IBI + "mS",600,585); // print the time between heartbeats in mS text(BPM + " BPM",600,200); // print the Beats Per Minute text("Pulse Window Scale " + nf(zoom,1,2), 150, 585); // show the current scale of Pulse Window // DO THE SCROLLBAR THINGS scaleBar.update (mouseX, mouseY); scaleBar.display(); } else { // SCAN BUTTONS TO FIND THE SERIAL PORT autoScanPorts(); if(refreshPorts){ refreshPorts = false; drawDataWindows(); drawHeart(); listAvailablePorts(); } for(int i=0; i<numPorts+1; i++){ button[i].overRadio(mouseX,mouseY); button[i].displayRadio(); } } } //end of draw loop void drawDataWindows(){ // DRAW OUT THE PULSE WINDOW AND BPM WINDOW RECTANGLES noStroke(); fill(eggshell); // color for the window background rect(255,height/2,PulseWindowWidth,PulseWindowHeight); rect(600,385,BPMWindowWidth,BPMWindowHeight); } void drawPulseWaveform(){ // DRAW THE PULSE WAVEFORM // prepare pulse data points RawY[RawY.length-1] = (1023 - Sensor) - 212; // place the new raw datapoint at the end of the array zoom = scaleBar.getPos(); // get current waveform scale value offset = map(zoom,0.5,1,150,0); // calculate the offset needed at this scale for (int i = 0; i < RawY.length-1; i++) { // move the pulse waveform by RawY[i] = RawY[i+1]; // shifting all raw datapoints one pixel left float dummy = RawY[i] * zoom + offset; // adjust the raw data to the selected scale ScaledY[i] = constrain(int(dummy),44,556); // transfer the raw data array to the scaled array } stroke(250,0,0); // red is a good color for the pulse waveform noFill(); beginShape(); // using beginShape() renders fast for (int x = 1; x < ScaledY.length-1; x++) { vertex(x+10, ScaledY[x]); //draw a line connecting the data points } endShape(); } void drawBPMwaveform(){ // DRAW THE BPM WAVE FORM // first, shift the BPM waveform over to fit then next data point only when a beat is found if (beat == true){ // move the heart rate line over one pixel every time the heart beats beat = false; // clear beat flag (beat flag waset in serialEvent tab) for (int i=0; i<rate.length-1; i++){ rate[i] = rate[i+1]; // shift the bpm Y coordinates over one pixel to the left } // then limit and scale the BPM value BPM = min(BPM,200); // limit the highest BPM value to 200 float dummy = map(BPM,0,200,555,215); // map it to the heart rate window Y rate[rate.length-1] = int(dummy); // set the rightmost pixel to the new data point value } // GRAPH THE HEART RATE WAVEFORM stroke(250,0,0); // color of heart rate graph strokeWeight(2); // thicker line is easier to read noFill(); beginShape(); for (int i=0; i < rate.length-1; i++){ // variable 'i' will take the place of pixel x position vertex(i+510, rate[i]); // display history of heart rate datapoints } endShape(); } void drawHeart(){ // DRAW THE HEART AND MAYBE MAKE IT BEAT fill(250,0,0); stroke(250,0,0); // the 'heart' variable is set in serialEvent when arduino sees a beat happen heart--; // heart is used to time how long the heart graphic swells when your heart beats heart = max(heart,0); // don't let the heart variable go into negative numbers if (heart > 0){ // if a beat happened recently, strokeWeight(8); // make the heart big } smooth(); // draw the heart with two bezier curves bezier(width-100,50, width-20,-20, width,140, width-100,150); bezier(width-100,50, width-190,-20, width-200,140, width-100,150); strokeWeight(1); // reset the strokeWeight for next time } void listAvailablePorts(){ println(Serial.list()); // print a list of available serial ports to the console serialPorts = Serial.list(); fill(0); textFont(font,16); textAlign(LEFT); // set a counter to list the ports backwards int yPos = 0; int xPos = 35; for(int i=serialPorts.length-1; i>=0; i--){ button[i] = new Radio(xPos, 95+(yPos*20),12,color(180),color(80),color(255),i,button); text(serialPorts[i],xPos+15, 100+(yPos*20)); yPos++; if(yPos > height-30){ yPos = 0; xPos+=200; } } int p = numPorts; fill(233,0,0); button[p] = new Radio(35, 95+(yPos*20),12,color(180),color(80),color(255),p,button); text("Refresh Serial Ports List",50, 100+(yPos*20)); textFont(font); textAlign(CENTER); } void autoScanPorts(){ if(Serial.list().length != numPorts){ if(Serial.list().length > numPorts){ println("New Ports Opened!"); int diff = Serial.list().length - numPorts; // was serialPorts.length serialPorts = expand(serialPorts,diff); numPorts = Serial.list().length; }else if(Serial.list().length < numPorts){ println("Some Ports Closed!"); numPorts = Serial.list().length; } refreshPorts = true; return; } } void resetDataTraces(){ for (int i=0; i<rate.length; i++){ rate[i] = 555; // Place BPM graph line at bottom of BPM Window } for (int i=0; i<RawY.length; i++){ RawY[i] = height/2; // initialize the pulse window data line to V/2 } } |
Working
There are a couple of cool things you can do while the sketch is running. For example, you can:
-
Press ‘s‘ or ‘S‘ to take a screenshot of the program window
-
The image will be saved in the sketch folder as a .jpg
-
Press ‘r‘ or ‘R‘ to reset the data windows to zero
Note – Tightly put your finger on the pulse sensor by wrapping it with a sticky wrapper, and then moving the finger will change the bpm value.
Pulse Rate Monitor With Arduino & 16×2 Display
Connect LCD to Arduino Uno Board as follows.
- VCC to +5V
- GND to GND
- SDA to A4
- SCL to A5
Source Code
|
1 2 3 4 5 6 7 8 9 10 11 12 13 14 15 16 17 18 19 20 21 22 23 24 25 26 27 28 29 30 31 32 33 34 35 36 37 38 39 40 |
/* * DIY PROJECTS LAB */ #include <LiquidCrystal_I2C.h> LiquidCrystal_I2C lcd(0x27,16,2); int pulsePin = 0; // Heart Rate Sensor in A0 volatile int BPM; //Beats per minute volatile int Signal; // Pulse sensor data input volatile int IBI = 600; // time between pulses volatile boolean Pulse = false; // True when the pulse wave is high, false when it is Low volatile boolean QS = false; // True when the Arduino Searches for a Heart pulse void setup(){ pinMode(13, OUTPUT); lcd.init(); lcd.backlight(); lcd.clear(); Serial.begin(9600); interruptSetup(); } void loop(){ int pulso = analogRead(A0); if (pulso >= 530) { digitalWrite(13, HIGH); } else{ digitalWrite(13, LOW); } lcd.setCursor(1,0); lcd.print("BPM= "); lcd.print(BPM); lcd.print(" "); //Serial.print("PPM = "); Serial.println(BPM); Serial.println(Pulse); if (QS == true){ QS = false; } } |
Conclusion
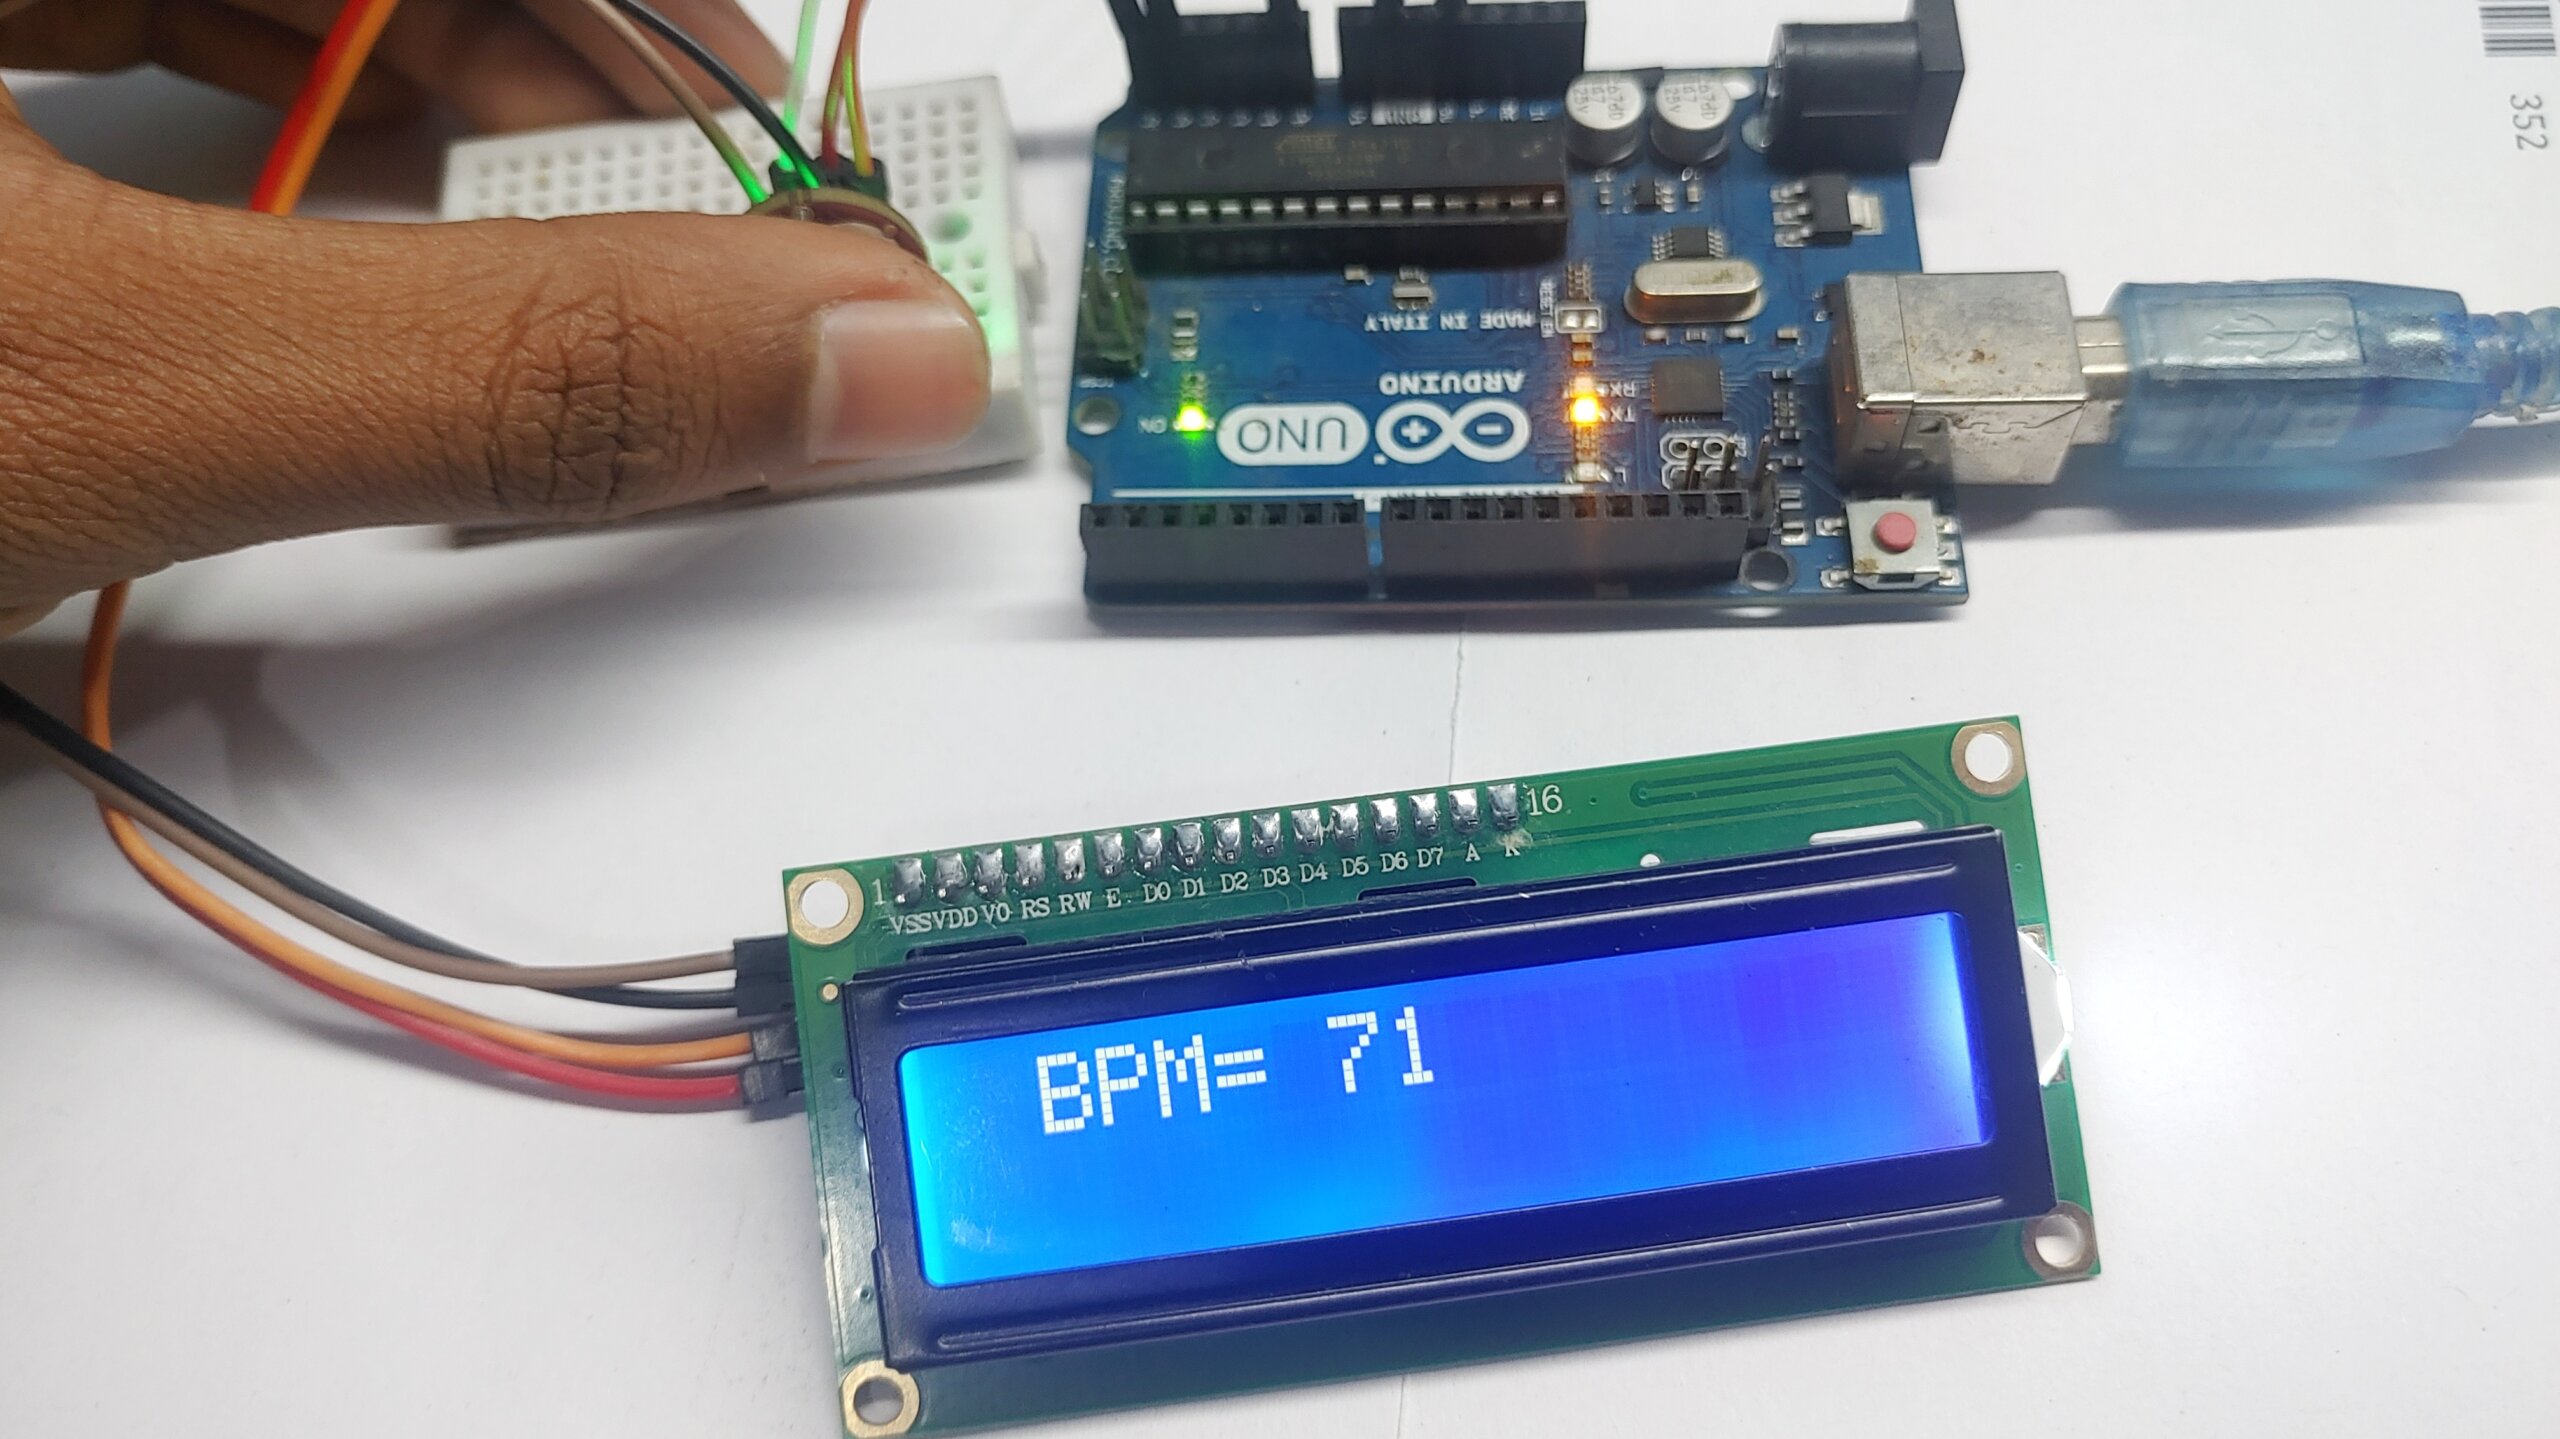
The heart beat (BPM) can be measured using Arduino and Pulse Sensor to measure the pulse rate and display it on the 16×2 LCD screen.
Note: This sensor is not medically or FDA-approved. It is designed for hobby projects and demonstrations and should not be used for health-critical applications.
Video Explanation:

