
In this tutorial, we will build an ESp32-based real-time IoT Energy Monitoring System. that allows you to monitor your energy consumption in real-time.
The process of power measurement becomes boring for AC power supplies, accompanied by reactive loads every real device has reactive components, to monitor power accurately we must calculate the instantaneous power at every moment and then multiply it with the instantaneous current draw, thus from the literature of basic electronics we have power.
Thank You, NextPCB!
This project was made possible with the help of NextPCB. If you need PCB services, check out NextPCB’s website for options like PCB assembly and an online Gerber Viewer.
Just to let you know, they’re currently offering free PCB assembly for 5 PCs.
Required Components
Ensure you have the following components:
- ESP32 Board (Amazon.com )
- SCT013 Current Sensors (Amazon.com)
- Zmpt101b voltage sensor (Amazon.com)
- Breadboard (Amazon.com)
- Jumper Wires (Amazon.com)
- Wi-Fi
This is an approach, though ideal we avoid in real life because it poses some serious design challenges, and in the realm of the digital world, we are converting analog voltage levels to digital and then we move to filter those using the Emonlib library, despite rigorous research and optimizations this still poses a 9-11% deviation from actual values, especially at low current values, and the current meters has its limitations, and the ADC of esp32 being non-linear.
SCT-013 current sensor
The SCT013 sensors help us measure the amount of electrical current flowing through a wire. without cropping the wire. These sensors work by using a unique method called electromagnetic induction.
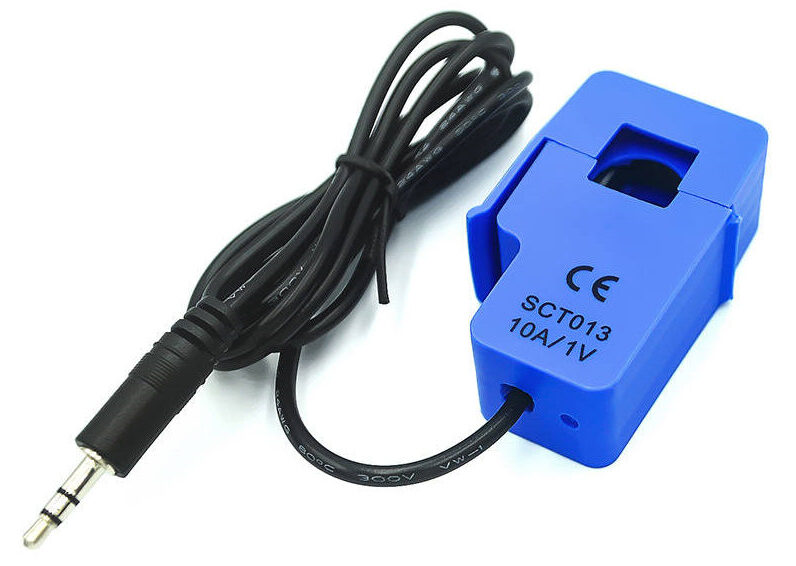 It works by detecting the magnetic field that is produced by the current, and then converting that magnetic field into an electric signal that can be read by ESP32.
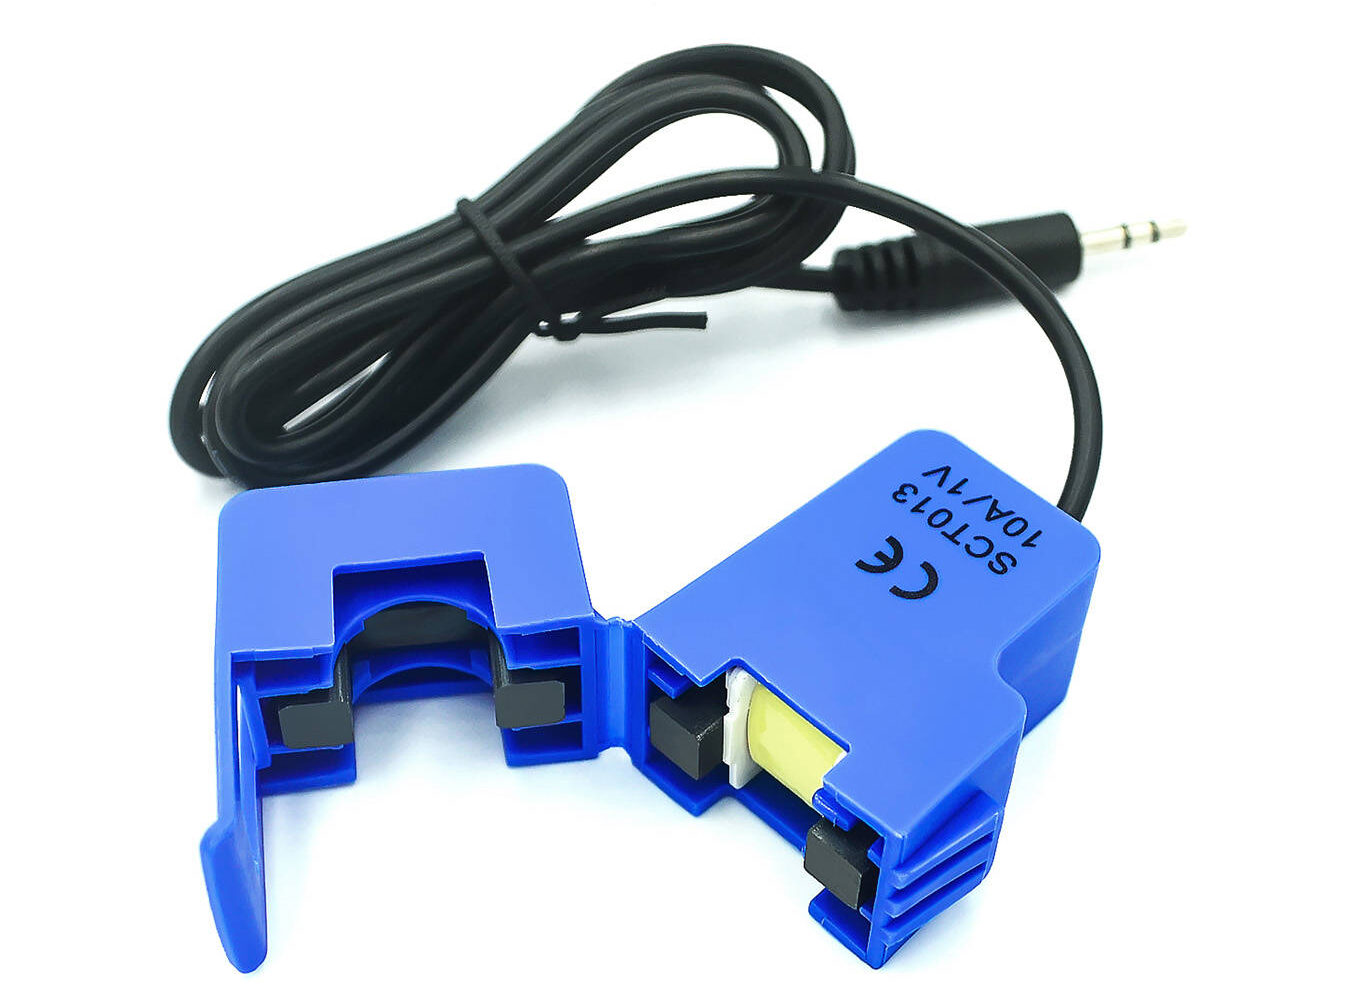
You can simply clamp it on a wire and connect it to get the readings. The sensor can be connected to an ESP32 board to read the current values and use them for different purposes, such as Energy monitoring and power consumption.
The SCT-013 is a suitable device that can be easily connected to either the live or neutral wire without any electrical work applying high voltage.
![]()
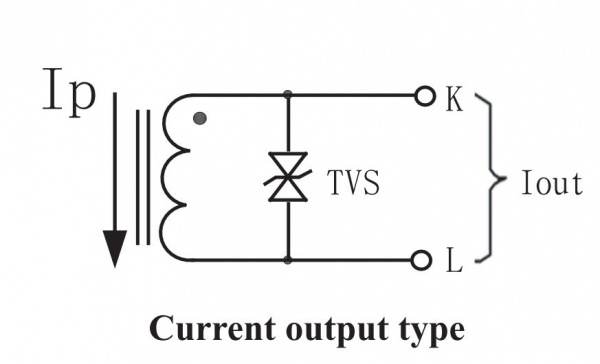
The sensor has a direct winding, a magnetic core, and a secondary winding. These are all composed of many Turns of fine Wire enclosed in the transformer casing.
SCT-013 current sensor Internal Structure
SCT-013 current sensor specs
Here are some specifications for the SCT-013 current sensor:
- Input Current Range: 0-30A AC
- Turns Ratio: 1800:1
- Non-linearity: <±3%
- Phase Shift: <±1°
- Operating Temperature: -25°C to +70°C
- Output Connector: 3.5mm audio jack or 3-pin header
- Frequency Range: 50Hz – 60Hz
- Dielectric Strength: 6000V AC/1min
- Dimensions: 50mm x 34mm x 25mm
Note – These specifications may differ on the manufacturer and model of the SCT-013 current sensor, so it is always important to refer to the datasheet for the specific specifications.
Current measurement:
Even though we covered this in our previous guide ( Arduino SCT-013 Sensor Tutorial ), I’d like to add a few points. You can use the below code for multiple phases, but be careful. Not all pins on the ESP32 can handle analog input. To learn more about this, check out the Page no. 14 ESP32 ADC Datasheet.
ZMPT101B Voltage Sensor Module
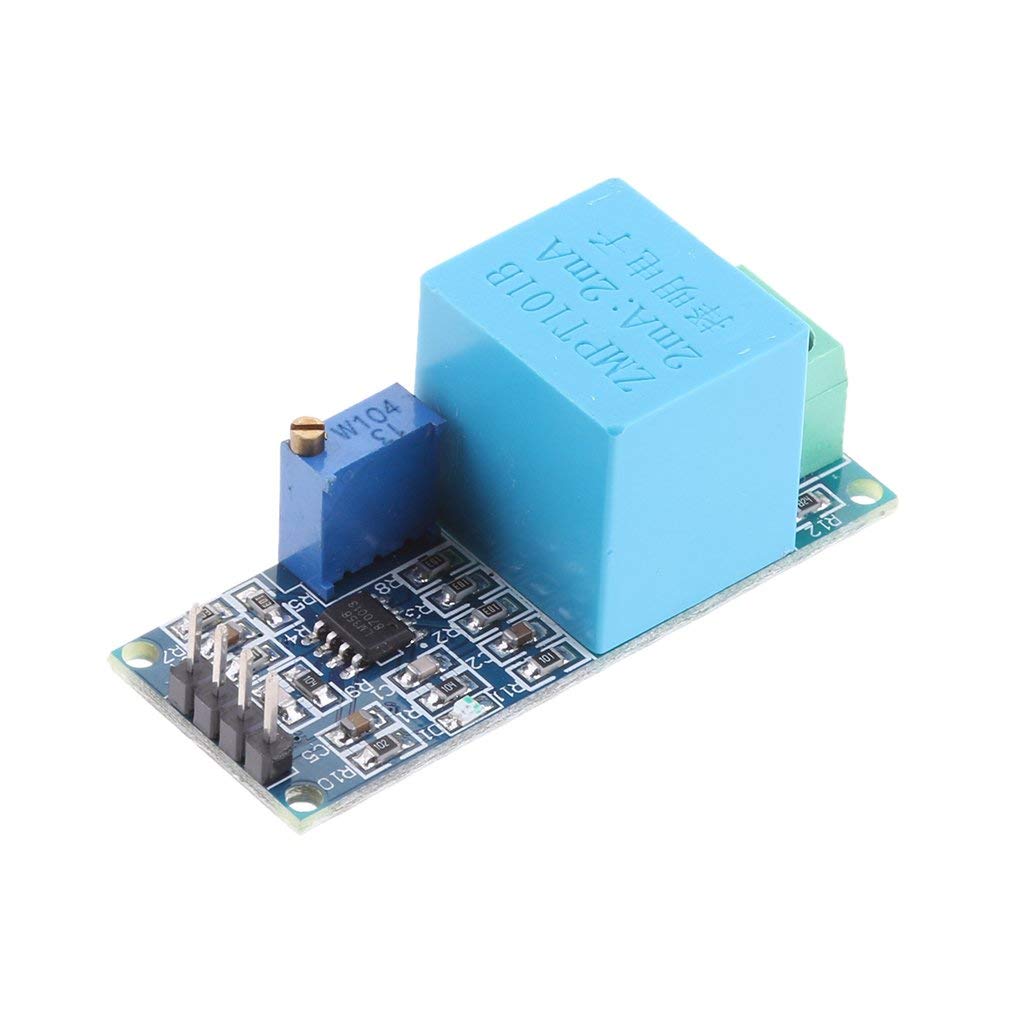
The ZMPT101B Voltage Sensor Module allows you to measure AC voltage using a microcontroller. It converts the AC voltage into an Analog signal that the microcontroller can understand. With this module, you can easily measure AC voltage in your tasks, It is generally used in applications such as power monitoring, home automation, and smart energy meters. Check out the previous post on ZMPT101B Voltage Sensor with Arduino
Circuit Diagram & Schematic
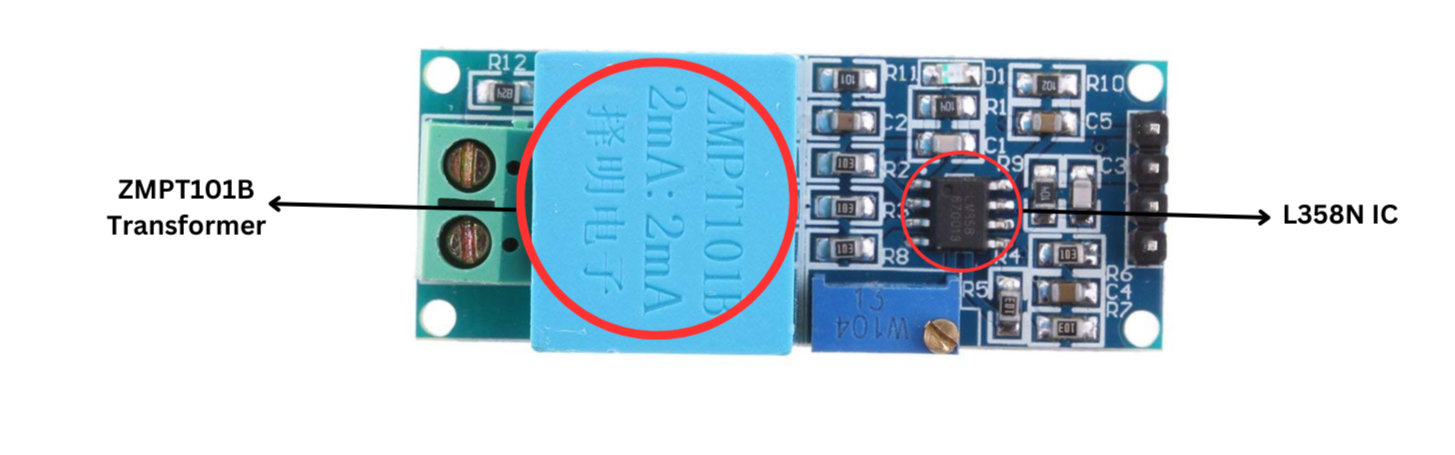
The ZMPT101B module is made with an LM358N IC chip, some resistors, and a few capacitors that help reduce noise or unwanted electrical signals.
Pinout of ZMPT101B Module
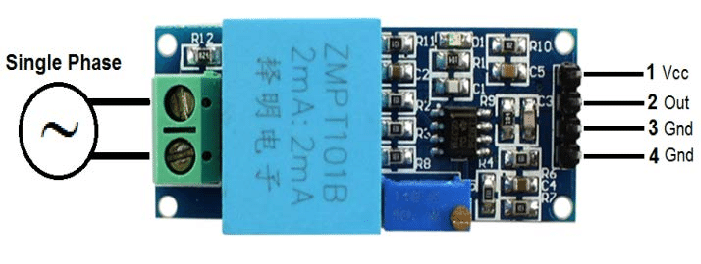
The ZMPT101B module has 4 pins:
- VCC
- OUT
- GND
- GND
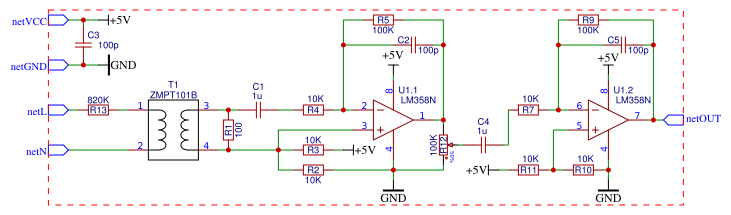
Voltage measurement :
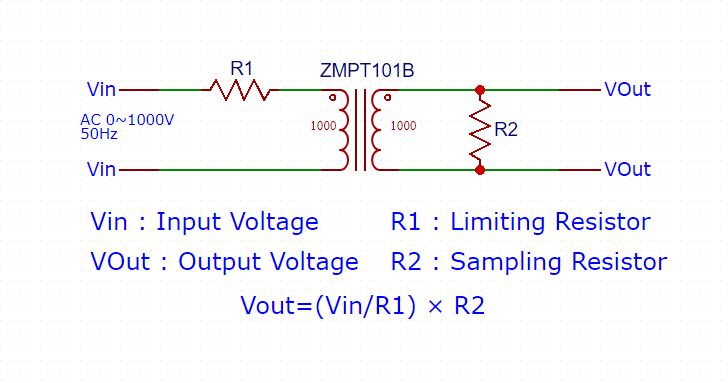
Measuring voltage is straightforward. Unlike current measurements, there’s no need to worry about burden resistors. The circuit for voltage measurement is basic—it’s like a transformer and amplifier combo using an LM358 which is important for it to work correctly.
The working circuit is shown below, the module itself is nothing but an isolation transformer and lm358-based amplifier, which also provides s DC bias to the circuit.
ESP32-Based Real-Time IoT Energy Monitoring System
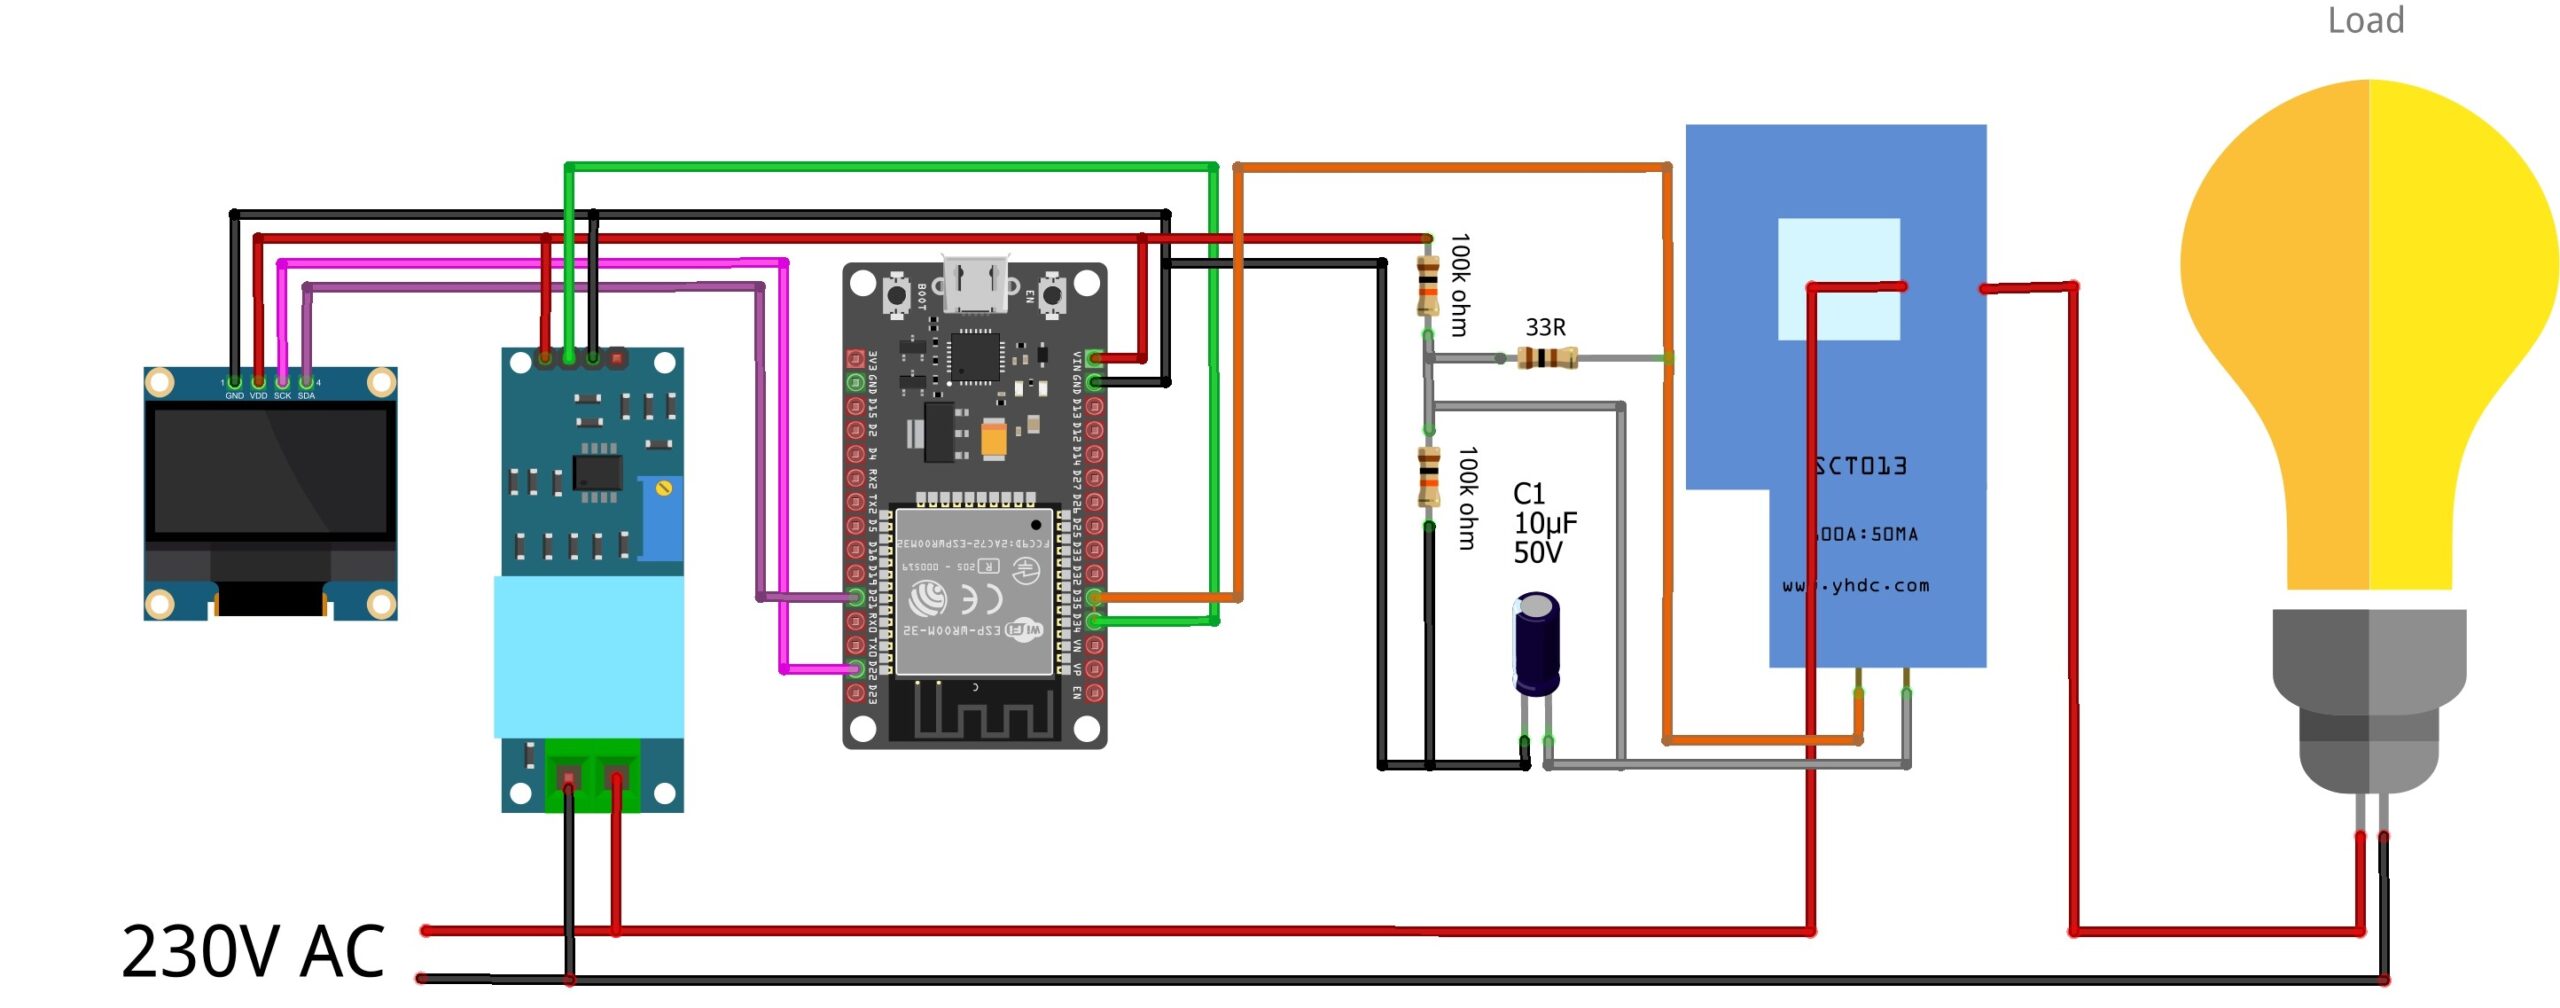
Connect the VCC and GND of the SCT-013 Current Sensor and ZMPT101B Voltage Sensor to the Vin and GND of ESP32.
The ZMPT101B’s analog output connects to GPIO34, and SCT-013’s analog output connects to GPIO35 on the ESP32. Complete the circuit with two 100K resistors, one 33-ohm resistor, and a 10uF capacitor.
Connect the VCC, GND, SDA & SCL of the OLED Display to ESP32 5V, GND, GPIO21 & GPIO22 of ESP32 respectively
Source Code:
This code is an Arduino sketch that implements an ESP32 Real-Time IoT Energy Monitoring System. The code uses several libraries such as Adafruit_GFX, EmonLib, Adafruit_SSD1306, ESPAsyncWebServer, and AsyncTCP.
Copy and paste the code below into your Arduino IDE. Modify the lines containing WiFi SSID, and password, with your credentials.
|
1 2 3 4 |
// Replace network credentials with your own WiFi details const char* ssid = "Note 10s"; const char* password = "abcd1234"; |
After making the changes, upload the code to your ESP32 board by selecting the ESP32 Dev Module, choosing the correct COM port, and pressing the upload button in the Arduino IDE.
|
1 2 3 4 5 6 7 8 9 10 11 12 13 14 15 16 17 18 19 20 21 22 23 24 25 26 27 28 29 30 31 32 33 34 35 36 37 38 39 40 41 42 43 44 45 46 47 48 49 50 51 52 53 54 55 56 57 58 59 60 61 62 63 64 65 66 67 68 69 70 71 72 73 74 75 76 77 78 79 80 81 82 83 84 85 86 87 88 89 90 91 92 93 94 95 96 97 98 99 100 101 102 103 104 105 106 107 108 109 110 111 112 113 114 115 116 117 118 119 120 121 122 123 124 125 126 127 128 129 130 131 132 133 134 135 136 137 138 139 140 141 142 143 144 145 146 147 148 149 150 151 152 153 154 155 156 157 158 159 160 161 162 163 164 165 166 167 168 169 170 171 172 173 174 175 176 177 178 179 180 181 182 183 184 185 186 187 188 189 190 191 192 193 194 195 196 197 198 199 200 201 202 203 204 205 206 207 208 209 210 211 212 213 214 215 216 217 218 219 220 221 222 223 224 225 226 227 228 229 230 231 232 233 234 235 236 237 238 239 240 241 242 243 244 245 246 247 248 249 250 251 252 253 254 255 256 257 258 259 260 261 262 263 264 265 266 267 268 269 270 271 272 273 274 275 276 277 278 279 280 281 282 283 284 285 286 287 288 289 290 291 292 293 294 295 296 297 298 299 300 301 302 303 304 305 306 307 308 309 310 311 312 313 314 315 316 317 318 319 320 321 322 323 324 325 326 327 328 329 330 331 332 333 334 335 336 337 338 339 340 341 342 343 344 345 346 347 348 349 350 351 352 353 354 355 356 357 358 359 360 361 362 363 364 365 366 367 368 369 370 371 372 373 374 375 376 377 378 379 380 381 382 383 384 385 386 387 388 389 390 391 392 393 394 395 396 397 398 399 400 401 402 403 404 405 406 407 408 409 410 411 412 413 414 415 416 417 418 419 420 421 422 423 424 425 426 427 428 429 430 431 432 433 434 435 |
/* Calibrates the current sensor (SCT013)*/ /* ----------------------------------------------------*/ /* Instructions: 1. Set up the hardware, the potentiometer of the voltage sensor should be already adjusted. 2. Find an "almost pure" resistive load (no motors, no reactors, no electromagnets, no LEDs). Examples: heater, boiler, electric shower, electric oven, kettle... 3. Install a voltmeter and ammeter to use as reference. 4. Connect the voltage measurement and current measurement sensors. 5. Edit the sketch *calibrate-vi.ino* and set the correct GPIO pins for the sensors. 6. Set the calibration coefficients CV1, CV2, CV3, CI1, CI2 and CI3 to 1000 in the same file. 7. Compile and update the code from Arduino IDE. 8. Watch the values in the serial terminal and wait for them to stabilize. Use 115200bps as baud rate. 9. Take a note of the measured current (I) and voltage (V) from the ESP32 and the current and voltage from the reference voltmeter (Vr) and ammeter (Ir). 10. Calculate the calibration factors: CVnew = Vr*CVold/V, CInew = Ir*CIold/I where CVold and CIold are the previous calibrations from the sketch (initially 1000). 11. Change the values under the "Calibration" section of the code to the calculated ones (CInew and CVnew). 12. Compile and upload the code again, watch the serial monitor until the data stabilizes and then check if the measurements are correct. 13. Repeat steps 8 to 12 if necessary. */ // Include libraries #include <SPI.h> #include <Wire.h> #include <Adafruit_GFX.h> #include <Adafruit_SSD1306.h> #include <AsyncTCP.h> #include <ESPAsyncWebServer.h> #include <Arduino_JSON.h> // Define constants #define SCREEN_WIDTH 128 // OLED display width, in pixels #define SCREEN_HEIGHT 64 // OLED display height, in pixels // Replace with your own WiFi credentials const char* ssid = "Note 10s"; const char* password = "abcd1234"; bool GPIO_State = 0; const int Led_Pin = 2; float v1 = 0; float cur = 0; float power = 0 ; String ip = "0.0.0.0" ; float ptime = 0 ; JSONVar readings; // Create AsyncWebServer object on port 80 AsyncWebServer server(80); AsyncWebSocket ws("/ws"); // Initialize objects // Declaration for an SSD1306 display connected to I2C (SDA, SCL pins) // The pins for I2C are defined by the Wire-library. // On an arduino UNO: A4(SDA), A5(SCL) // On an arduino MEGA 2560: 20(SDA), 21(SCL) // On an arduino LEONARDO: 2(SDA), 3(SCL), ... #define OLED_RESET -1 // Reset pin # (or -1 if sharing Arduino reset pin) #define SCREEN_ADDRESS 0x3C ///< See datasheet for Address; 0x3D for 128x64, 0x3C for 128x32 Adafruit_SSD1306 display(SCREEN_WIDTH, SCREEN_HEIGHT, &Wire, OLED_RESET); #include "EmonLib.h" // Include Emon Library #define ESP32 // Pin configuration #define V1 34 #define I1 35 // Calibration settings (allways start with 1000) #define CV1 768.75 #define CI1 60.6 // HTML page stored in program memory char html_page[] PROGMEM = R"rawliteral( <!DOCTYPE HTML><html> <head> <title>ESP32 Power Meter</title> <meta name="viewport" content="width=device-width, initial-scale=1"> <link rel="icon" href="data:,"> <style>html { font-family: Arial, Helvetica, sans-serif; display: inline-block; text-align: center; } h1 { font-size: 1.8rem; color: white; } .topnav { overflow: hidden; background-color: #0A1128; } body { margin: 0; } .content { padding: 50px; } .card-grid { max-width: 800px; margin: 0 auto; display: grid; grid-gap: 2rem; grid-template-columns: repeat(auto-fit, minmax(200px, 1fr)); } .card { background-color: white; box-shadow: 2px 2px 12px 1px rgba(140,140,140,.5); } .card-title { font-size: 1.2rem; font-weight: bold; color: #034078 } .reading { font-size: 1.2rem; color: #1282A2; } </style> <title>ESP32 Power meter</title> <meta name="viewport" content="width=device-width, initial-scale=1"> <link rel="icon" href="data:,"> </head> <body> <div class="topnav"> <h1>SENSOR READINGS (WEBSOCKET)</h1> </div> <div class="content"> <div class="card-grid"> <div class="card"> <p class="card-title"><i class="fas fa-thermometer-threequarters" style="color:#059e8a;"></i> Voltage</p> <p class="reading"><span id="voltage"></span> V</p> </div> <div class="card"> <p class="card-title"> Current</p> <p class="reading"><span id="current"></span> A</p> </div> <div class="card"> <p class="card-title">Power</p> <p class="reading"><span id="power"></span> Watt</p> </div> </div> </div> <script> var gateway = `ws://${window.location.hostname}/ws`; var websocket; // Init web socket when the page loads window.addEventListener('load', onload); function onload(event) { initWebSocket(); } function getReadings(){ websocket.send("getReadings"); } function initWebSocket() { console.log('Trying to open a WebSocket connection…'); websocket = new WebSocket(gateway); websocket.onopen = onOpen; websocket.onclose = onClose; websocket.onmessage = onMessage; } // When websocket is established, call the getReadings() function function onOpen(event) { console.log('Connection opened'); getReadings(); } function onClose(event) { console.log('Connection closed'); setTimeout(initWebSocket, 2000); } // Function that receives the message from the ESP32 with the readings function onMessage(event) { console.log(event.data); var myObj = JSON.parse(event.data); var keys = Object.keys(myObj); for (var i = 0; i < keys.length; i++){ var key = keys[i]; document.getElementById(key).innerHTML = myObj[key]; } } </script> </body> </html> )rawliteral"; // Function to notify clients void notifyClients() { ws.textAll(getSensorReadings()); } String processor(const String& var){ Serial.println(var); return "boom" ; } // Function to get sensor readings String getSensorReadings(){ // NO1 readings["voltage"] = String(v1); readings["current"] = String(cur); readings["power"] = String(power); String jsonString = JSON.stringify(readings); return jsonString; } void handleWebSocketMessage(void *arg, uint8_t *data, size_t len) { AwsFrameInfo *info = (AwsFrameInfo*)arg; if (info->final && info->index == 0 && info->len == len && info->opcode == WS_TEXT) { //data[len] = 0; //String message = (char*)data; // Check if the message is "getReadings" //if (strcmp((char*)data, "getReadings") == 0) { //if it is, send current sensor readings String sensorReadings = getSensorReadings(); Serial.println(sensorReadings); notifyClients(); //} } } // WebSocket event handler void onEvent(AsyncWebSocket *server, AsyncWebSocketClient *client, AwsEventType type, void *arg, uint8_t *data, size_t len) { switch (type) { case WS_EVT_CONNECT: Serial.printf("WebSocket client #%u connected from %sn", client->id(), client->remoteIP().toString().c_str()); break; case WS_EVT_DISCONNECT: Serial.printf("WebSocket client #%u disconnectedn", client->id()); break; case WS_EVT_DATA: handleWebSocketMessage(arg, data, len); break; case WS_EVT_PONG: case WS_EVT_ERROR: break; } } // Initialize WebSocket void initWebSocket() { ws.onEvent(onEvent); server.addHandler(&ws); } EnergyMonitor emon1; // Phase 1 // Display initialization and data functions void disinit() { if (!display.begin(SSD1306_SWITCHCAPVCC, SCREEN_ADDRESS)) { Serial.println(F("SSD1306 allocation failed")); for (;;) ; // Don't proceed, loop forever } // Show initial display buffer contents on the screen -- // the library initializes this with an Adafruit splash screen. Serial.println(F("Display initialised")); display.clearDisplay(); display.display(); delay(200); // Pause for 2 seconds // Clear the buffer display.clearDisplay(); display.setTextSize(1); // Normal 1:1 pixel scale display.setTextColor(SSD1306_WHITE); display.setCursor(0, 20); display.println(F(" Diyprojectlabs.com")); display.display(); delay(5000); //printing the ip address to the screen display.setCursor(0, 48); display.print(ip); display.display(); } void disdat(float x , float y) { display.clearDisplay(); //delay(1); display.setTextSize(2); display.setCursor(0, 0); display.println(F("I-")); display.setCursor(24, 0); display.println(x); display.setCursor(115, 0); display.println("A"); display.setCursor(0, 16); display.println(F("v-")); display.setCursor(24, 16); display.println(y); display.setCursor(115, 16); display.println("V"); display.setCursor(1, 32); display.println(F("P-")); display.setCursor(24, 32); display.print(y * x); display.setCursor(115, 32); display.println("W"); display.setTextSize(1); display.setCursor(0, 56); display.print(ip); display.display(); } void setup() { Serial.begin(115200); WiFi.softAP(ssid, password); disinit(); disdat(0, 0); // Connect to Wi-Fi WiFi.begin(ssid, password); while (WiFi.status() != WL_CONNECTED) { delay(1000); Serial.println("Connecting to WiFi.."); } // Print ESP Local IP Address ip = WiFi.localIP().toString(); Serial.println(ip); initWebSocket(); // Route for root / web page server.on("/", HTTP_GET, [](AsyncWebServerRequest *request){ request->send_P(200, "text/html", html_page, processor); }); // Start server server.begin(); /* Analog attenuation: ADC_0db: sets no attenuation. ADC can measure up to approximately 800 mV (1V input = ADC reading of 1088). ADC_2_5db: The input voltage of ADC will be attenuated, extending the range of measurement to up to approx. 1100 mV. (1V input = ADC reading of 3722). ADC_6db: The input voltage of ADC will be attenuated, extending the range of measurement to up to approx. 1350 mV. (1V input = ADC reading of 3033). ADC_11db (default): The input voltage of ADC will be attenuated, extending the range of measurement to up to approx. 2600 mV. (1V input = ADC reading of 1575). */ analogSetPinAttenuation(V1, ADC_11db); analogSetPinAttenuation(I1, ADC_11db); // Phase 1 emon1.voltage(V1, CV1, 1.732); // Voltage: input pin, calibration, phase_shift emon1.current(I1, CI1); // Current: input pin, calibration. ptime = millis(); } void loop() { Serial.println("------------"); // Phase 1 emon1.calcVI(120, 2000); // Calculate all. No.of half wavelengths (crossings), time-out // emon1.serialprint(); // Print out all variables (realpower, apparent power, Vrms, Irms, power factor) float realPower = emon1.realPower; // extract Real Power into variable float apparentPower = emon1.apparentPower; // extract Apparent Power into variable float powerFactor = emon1.powerFactor; // extract Power Factor into Variable float supplyVoltage = emon1.Vrms; // extract Vrms into Variable float Irms = emon1.Irms; // extract Irms into Variable v1=supplyVoltage; cur = Irms; power = Irms * supplyVoltage; Serial.print("V1: "); Serial.print(supplyVoltage); Serial.print(", I1: "); Serial.println(Irms); disdat(Irms, supplyVoltage); getSensorReadings(); if ((millis()-ptime) > 5000 ) { notifyClients(); ptime = millis(); } ws.cleanupClients(); } |
The code is developed for easy understanding, but I’d like to share some key points:
- The implementation of WebSockets enables simultaneous communication with multiple devices at the same time.
- Including a 0.96″ OLED screen that displays sensor values and the IP address.
Working: ESP32 Based Real-Time IoT Energy Monitoring System
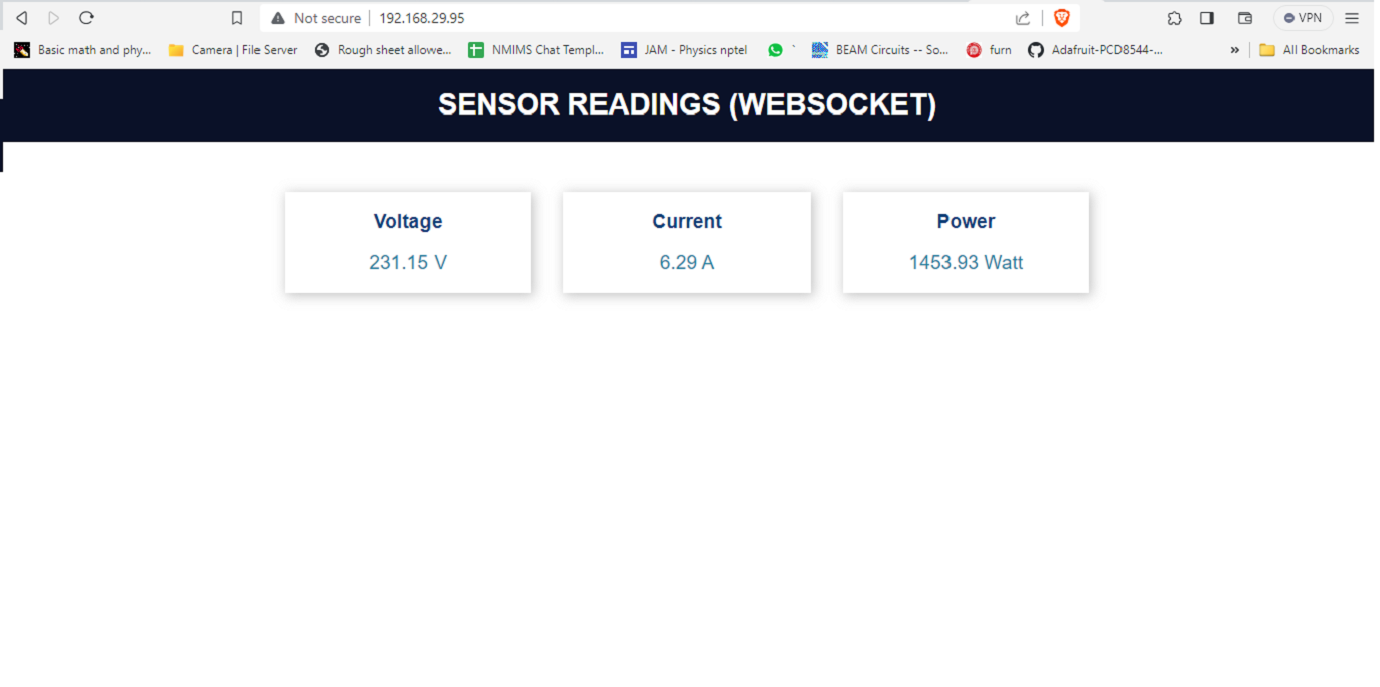
After Uploading the code, ESP32 displays its IP address on the OLED screen. Connect to the same network, enter the IP address in your browser, and upon successful connection, view a screen with data updates every 5 seconds. Feel free to adjust the refresh rate, although it’s advisable not to set it too frequently to avoid potential disruptions to other functionalities.
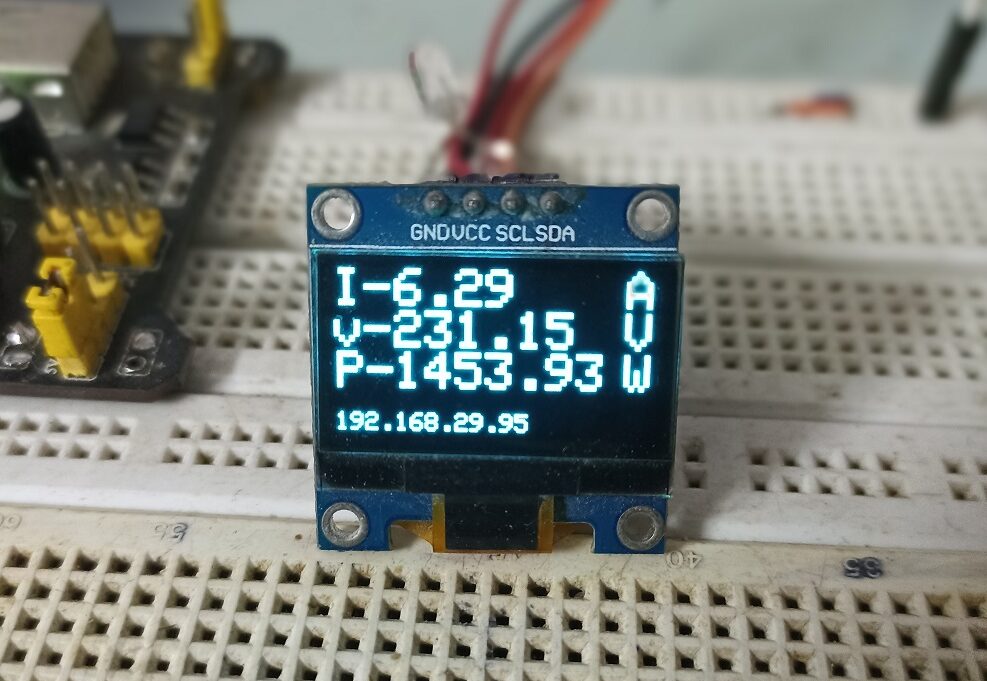
Now when the load is connected, the OLED Screen will display the Voltage and Current value on the OLED.
The energy meter data is uploaded to the web server after the interval of every 5 seconds. The data can be observed on the Web Dashboard.
FAQs
- Is using esp32 necessary, well yes can build this with literally any good uC with descent sampling time and resolution
- Is using SCT mandatory, absolutely not, you can build your current sensor, and being galvanically isolated we are quite safe from dangerous 220ac.
- Is the voltage sensor safe, apart from the low dielectric constant of the transformer used in some Chinese sensors, if you have purchased from a reputable source then you are fine,
- Well why don’t we use a resistor divider to measure voltage, you can do this if you have decent resistors but it won’t provide galvanic isolation and thus you need to insolate every part of the circuit and synthesize two sensors to protect me from getting shocked
- Can newbies try to build this, well I would say “The more you are afraid of high voltages the more it’s dangerous “Also, still you can first test with an isolation transformer with 220 volts which will hurt you until you touch both the wires
- Do I need to have home wifi to use this, absolutely not, although ESP32 can handle AP mode it has been omitted to reduce the load on the processor, and if you have a cell phone you can use your hotspot and connect, no internet connection is required, you can also do the same for the windows application.


